Facebook Marketing Project
These are the plots/models of a marketing campaign on Facebook. The data includes insights to number of users that registered for the specific website and the number of actual regular users of the site.


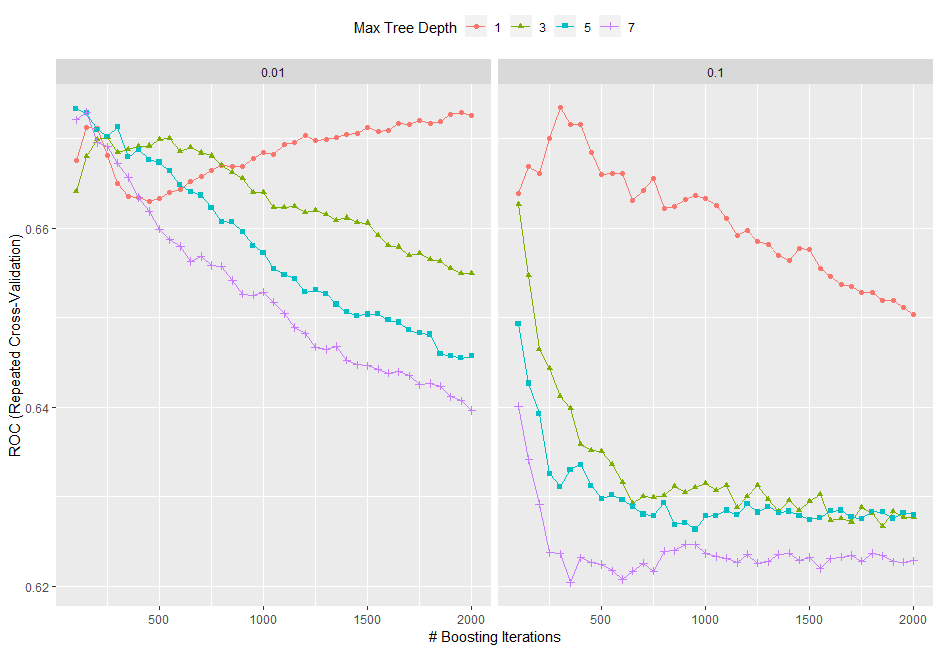
Stochastic Gradient Boosting Machines - Max Tree Depth 1, Number of Boosting Iterations 300, Shrinkage 0.10

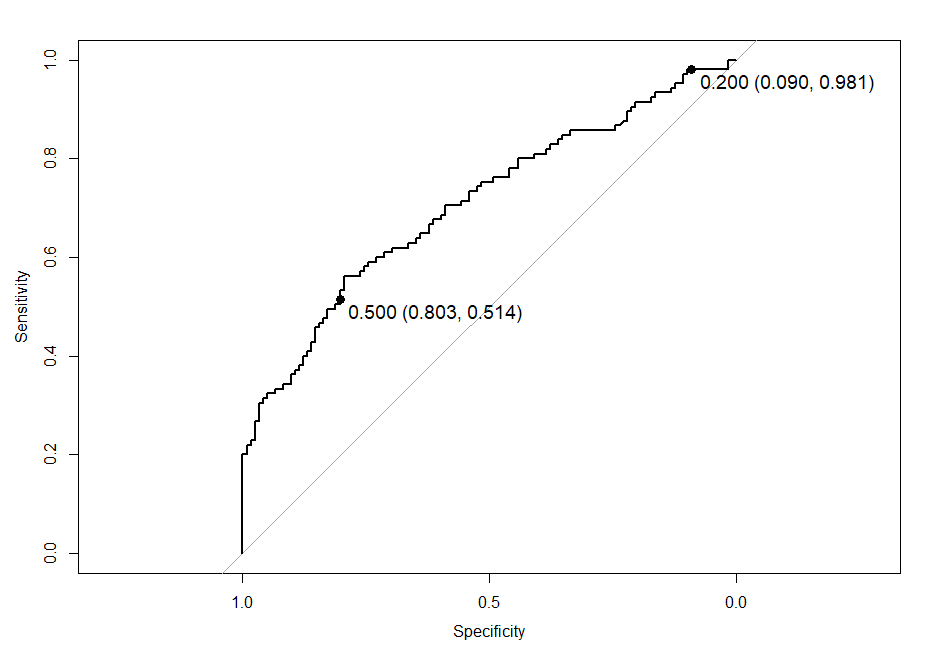
Reciver Operating Characteristic/Area Under the Curve - ROC/AUC

Principal Component Analysis
Dataset df3
This dataset contains 761 individuals and 11 variables, 1 quantitative variable is considered as illustrative.
1. Study of the outliers
The analysis of the graphs does not detect any outlier.
2. Inertia distribution
The inertia of the first dimensions shows if there are strong relationships between variables and suggests the number of dimensions that should be studied.
The first two dimensions of analyse express 71.55% of the total dataset inertia ; that means that 71.55% of the individuals (or variables) cloud total variability is explained by the plane. This percentage is high and thus the first plane represents an important part of the data variability. This value is strongly greater than the reference value that equals 23.77%, the variability explained by this plane is thus highly significant (the reference value is the 0.95-quantile of the inertia percentages distribution obtained by simulating 2284 data tables of equivalent size on the basis of a normal distribution).
From these observations, it is probably not useful to interpret the next dimensions.
Figure 2 - Decomposition of the total inertia
An estimation of the right number of axis to interpret suggests to restrict the analysis to the description of the first 3 axis. These axis present an amount of inertia greater than those obtained by the 0.95-quantile of random distributions (83.99% against 34.75%). This observation suggests that only these axis are carrying a real information. As a consequence, the description will stand to these axis.
3. Description of the plane 1:2
Figure 3.1 - Individuals factor map (PCA) The labeled individuals are those with the higher contribution to the plane construction.
Figure 3.2 - Variables factor map (PCA) The variables in black are considered as active whereas those in blue are illustrative. The labeled variables are those the best shown on the plane.
The dimension 1 opposes individuals characterized by a strongly positive coordinate on the axis (to the right of the graph) to individuals characterized by a strongly negative coordinate on the axis (to the left of the graph).
The group 1 (characterized by a positive coordinate on the axis) is sharing :
- high values for the variables clicks, spent, impressions, campaign_id, total_conversion, approved_conversion and gender (variables are sorted from the strongest).
- low values for the variables interest1, interest2, interest3 and age (variables are sorted from the weakest).
The group 2 (characterized by a negative coordinate on the axis) is sharing :
- high values for the variables interest1, interest2 and interest3 (variables are sorted from the strongest).
- low values for the variables spent, clicks, impressions, total_conversion and approved_conversion (variables are sorted from the weakest).
The group 3 (characterized by a negative coordinate on the axis) is sharing :
- high values for the variable age.
- low values for the variables interest3, interest2, interest1, campaign_id, clicks, spent, impressions, total_conversion, approved_conversion and gender (variables are sorted from the weakest).
Note that the variables impressions, clicks and spent are highly correlated with this dimension (respective correlation of 0.95, 0.92, 0.93). These variables could therefore summarize themselve the dimension 1.
The dimension 2 opposes individuals characterized by a strongly positive coordinate on the axis (to the top of the graph) to individuals characterized by a strongly negative coordinate on the axis (to the bottom of the graph).
The group 1 (characterized by a positive coordinate on the axis) is sharing :
- high values for the variables interest1, interest2 and interest3 (variables are sorted from the strongest).
- low values for the variables spent, clicks, impressions, total_conversion and approved_conversion (variables are sorted from the weakest).
The group 2 (characterized by a negative coordinate on the axis) is sharing :
- high values for the variable age.
- low values for the variables interest3, interest2, interest1, campaign_id, clicks, spent, impressions, total_conversion, approved_conversion and gender (variables are sorted from the weakest).
Note that the variables interest1, interest2 and interest3 are highly correlated with this dimension (respective correlation of 0.04, 0.04, 0.03). These variables could therefore summarize themselve the dimension 2.
4. Description of the dimension 3
Figure 4.1 - Individuals factor map (PCA) The labeled individuals are those with the higher contribution to the plane construction.
Figure 4.2 - Variables factor map (PCA) The variables in black are considered as active whereas those in blue are illustrative. The labeled variables are those the best shown on the plane.
The dimension 3 opposes individuals characterized by a strongly positive coordinate on the axis (to the right of the graph) to individuals characterized by a strongly negative coordinate on the axis (to the left of the graph).
The group 1 (characterized by a positive coordinate on the axis) is sharing :
- low values for the variables gender, age, campaign_id, impressions, spent, clicks and total_conversion (variables are sorted from the weakest).
The group 2 (characterized by a positive coordinate on the axis) is sharing :
- high values for the variables age, clicks and spent (variables are sorted from the strongest).
- low values for the variables gender and campaign_id (variables are sorted from the weakest).
The group 3 (characterized by a negative coordinate on the axis) is sharing :
- high values for the variables gender, campaign_id and total_conversion (variables are sorted from the strongest).
- low values for the variables age, clicks and spent (variables are sorted from the weakest).
The group 4 (characterized by a negative coordinate on the axis) is sharing :
- high values for the variables gender, campaign_id, age, impressions, spent and clicks (variables are sorted from the strongest).
5. Classification
Figure 5 - Ascending Hierarchical Classification of the individuals. The classification made on individuals reveals 3 clusters.
The cluster 1 is made of individuals sharing :
- high values for the variables interest1, interest3 and interest2 (variables are sorted from the strongest).
The cluster 2 is made of individuals sharing :
- low values for the variables interest3, interest1, interest2, impressions, spent, clicks, total_conversion, approved_conversion and campaign_id (variables are sorted from the weakest).
The cluster 3 is made of individuals sharing :
- high values for the variables impressions, spent, clicks, total_conversion, approved_conversion, campaign_id and gender (variables are sorted from the strongest).
- low values for the variables age, interest2, interest1 and interest3 (variables are sorted from the weakest).

